Power BI Basics
Microsoft Power BI Desktop is a business intelligence application that enables you to connect to a variety of data sources, including SQL databases, and transform that data into detailed, insightful reports.
If you are new to Power BI, this section will provide a short introduction to Power BI and the main components of the user interface. The intention is to provide you with a basic understanding of Power BI so that you can complete the Power BI Template Tutorial.
For more detailed information on Power BI and creating reports, refer to the Microsoft Power BI Online Help.
Data Model
Power BI reports are based on a defined data model, which is a logical representation of the relationships within the source data. Power BI enables you to use a variety of different visuals, including matrices, tables, charts, and graphs, to create reports based on the underlying data model.
Within the data model, source data can be combined, transformed, manipulated, or removed in order to provide more useful data and, as a result, more insightful reports. The data model is pre-defined in the sample Power BI template provided with VIM Enterprise.
In the context of VIM Enterprise, the Power BI data model defines the relationships between the BIM data tables and columns that have been extracted from a VIM file and stored in SQL Server. The Model view in Power BI is a visual mapping of the data tables and columns, and their relationships. The Table view provides a detailed view of the tabular data.
Power BI User Interface
To create reports in Power BI, you need to know the basic components of the Power BI user interface. The sections below provide descriptions of the components used in this tutorial.
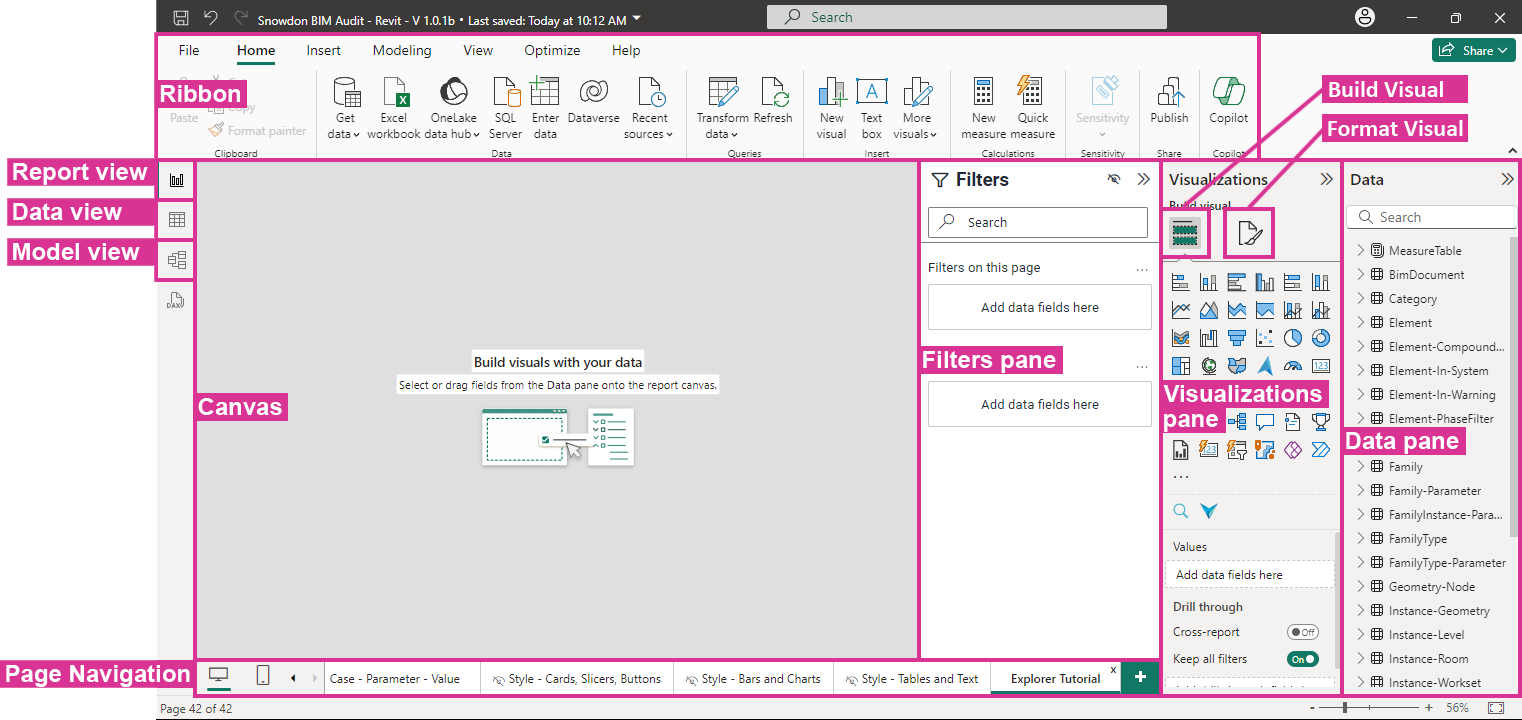
Ribbon
The Power BI Desktop ribbon contains different tabs that provide access to many common tasks, such as file operations, data connections, and adding visuals to reports.
Canvas
The Power BI Canvas is where you create your reports by adding visuals. You can arrange visuals within the Canvas, and customize the contents and appearance of each visual.
Report View
The Report view is used to create and display reports. The Report view includes the components required to create and configure visuals, including the Canvas, Filters pane, Visualizations pane, and Data pane.
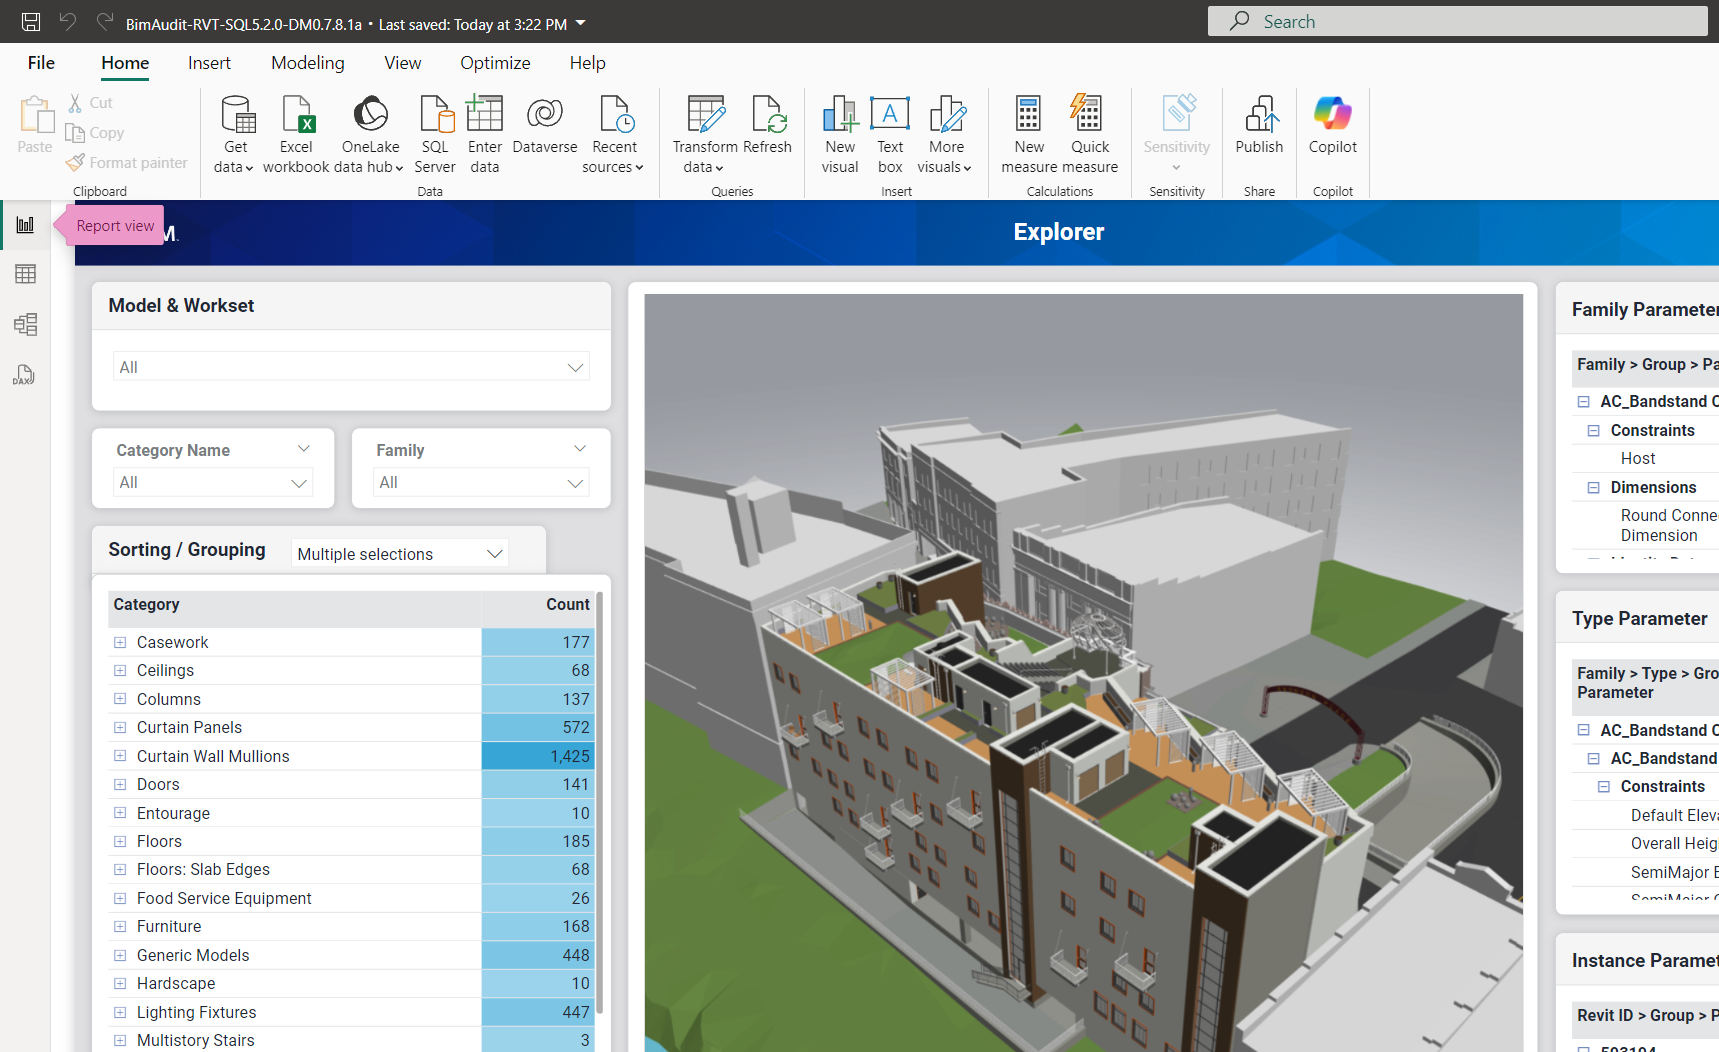
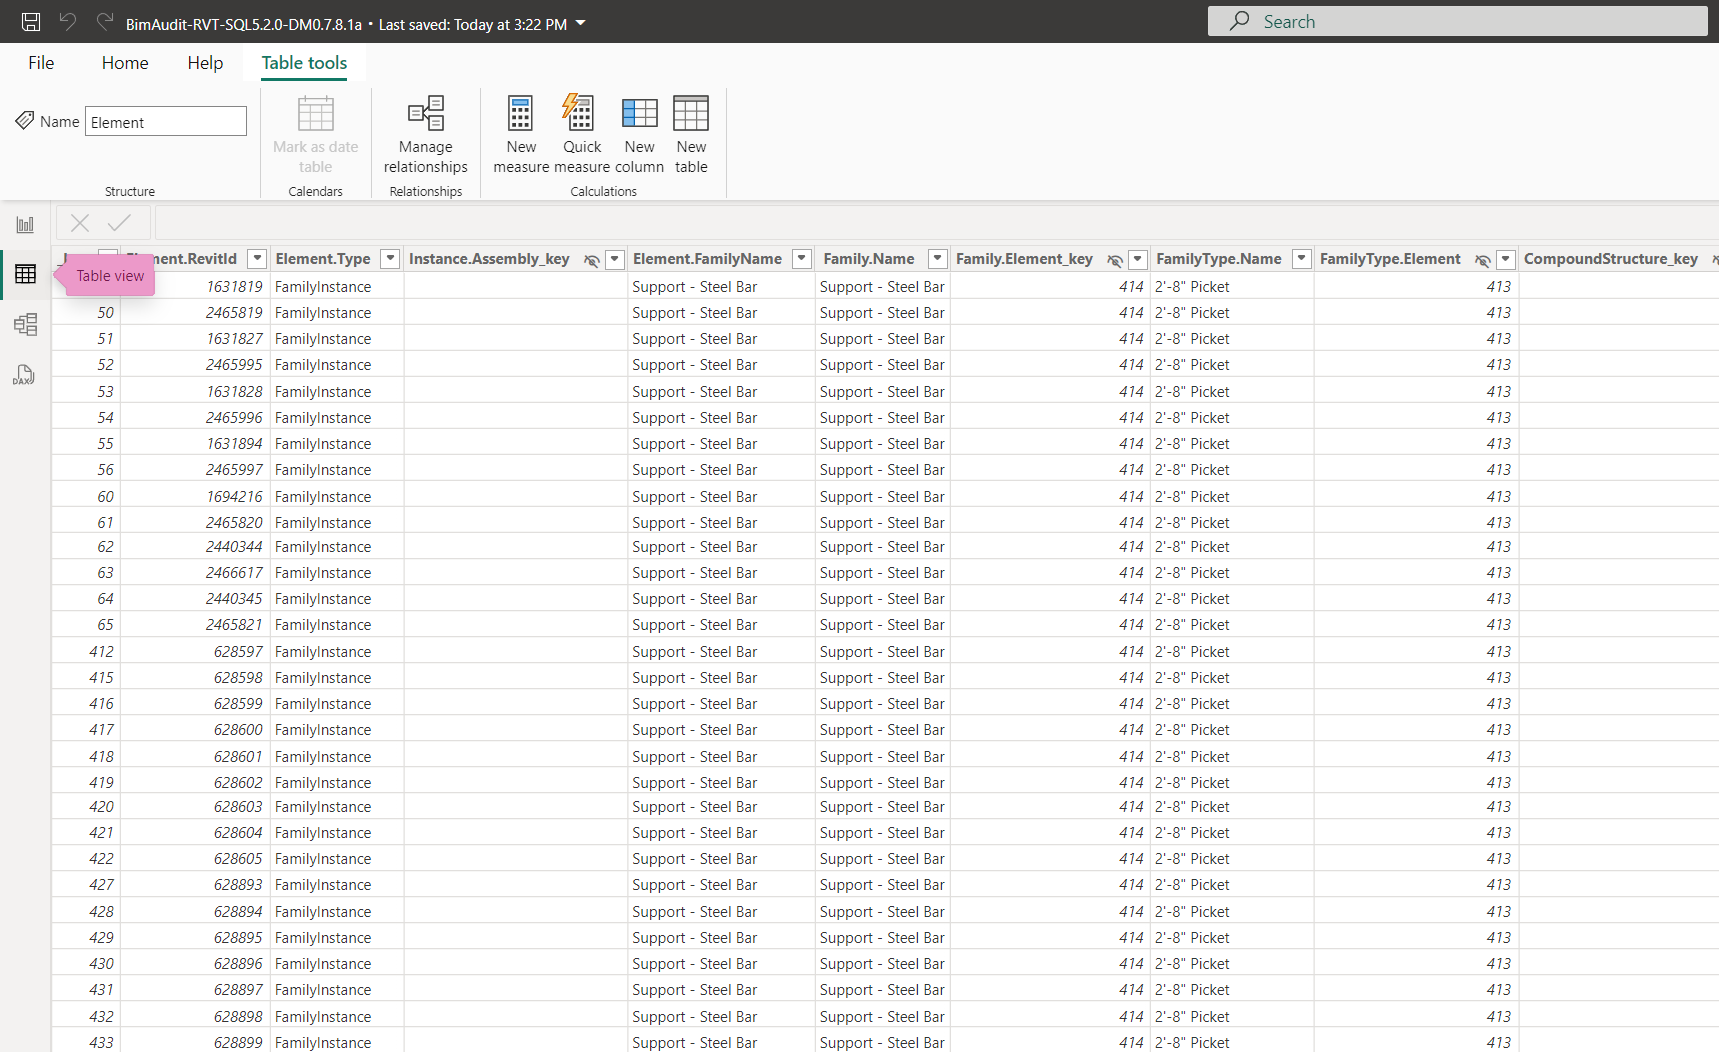
Table View
The Table view displays the tables in the defined data source. The Table view includes the Data pane, and enables you to see all of the available BIM data, some of which might be hidden from the Report view. You can select individual tables, sort and filter the data, and search for specific data types.
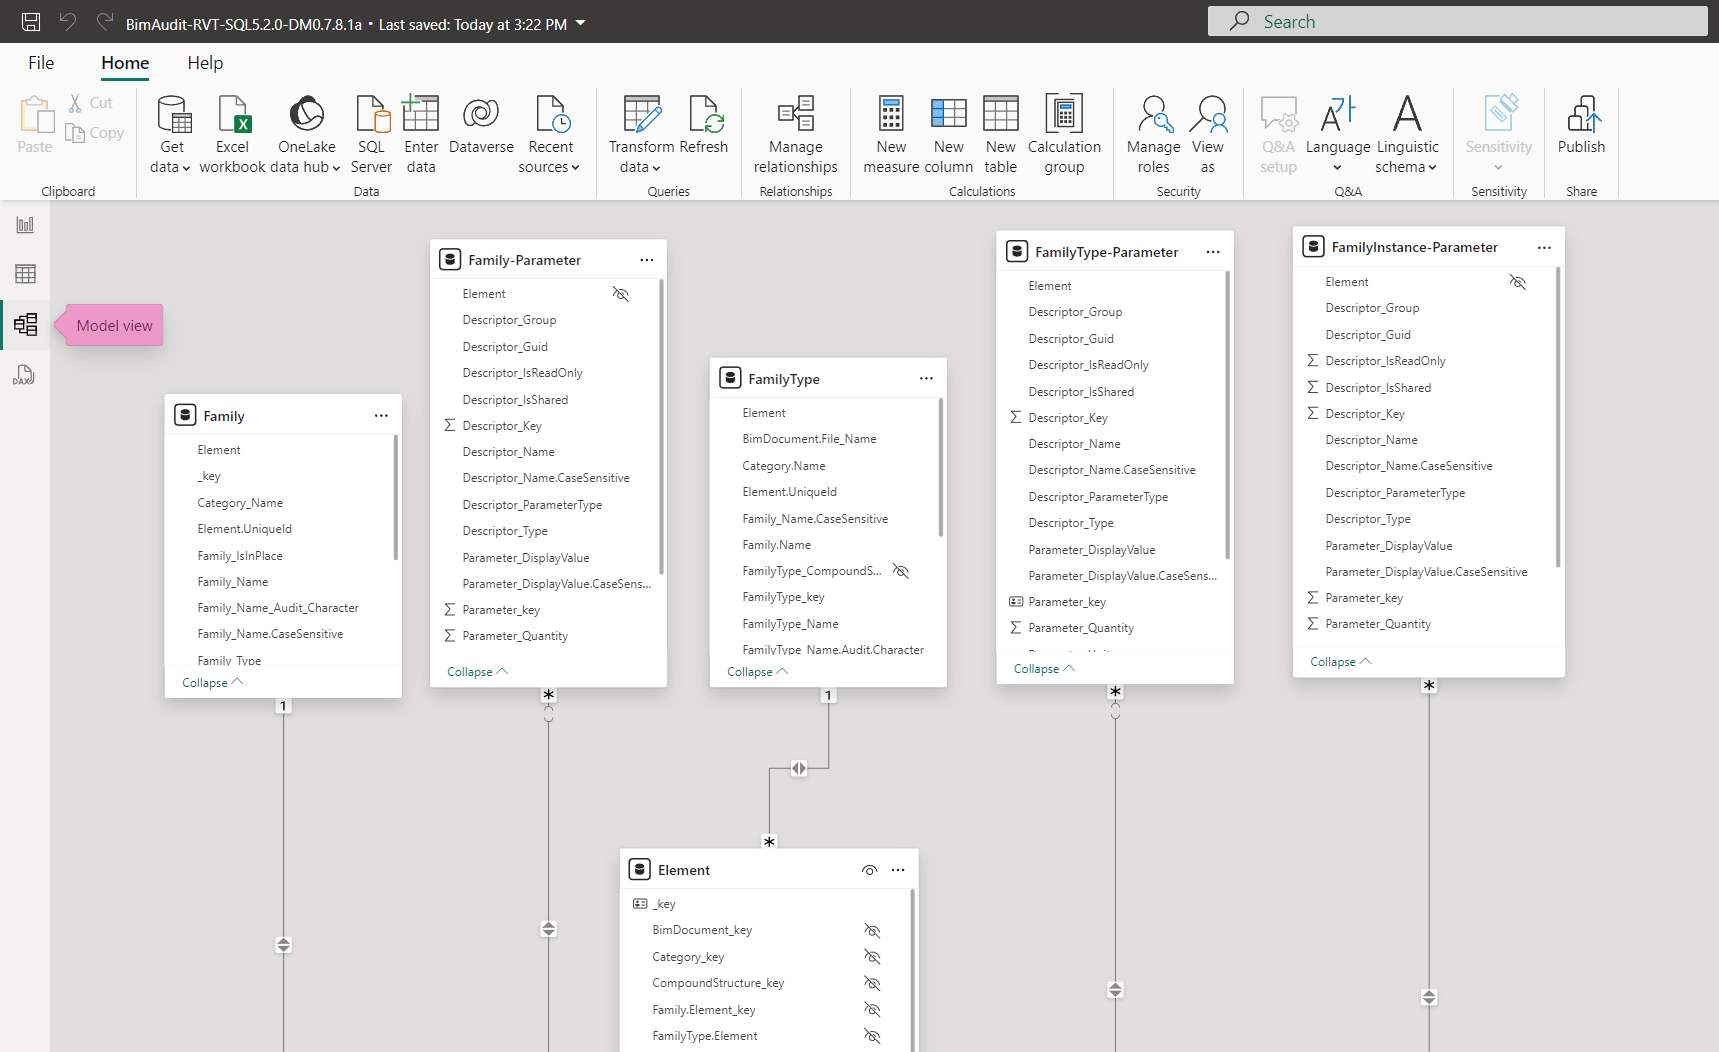
Model View
The Model view provides a graphic display of the structure and relationships between the tables and columns in the Power BI data model. The data model is specific to the sample report template and acts as an intermediary between the BIM source data and the Power BI visuals used to create reports. The Model view can also be used to modify the data model or create new data models.
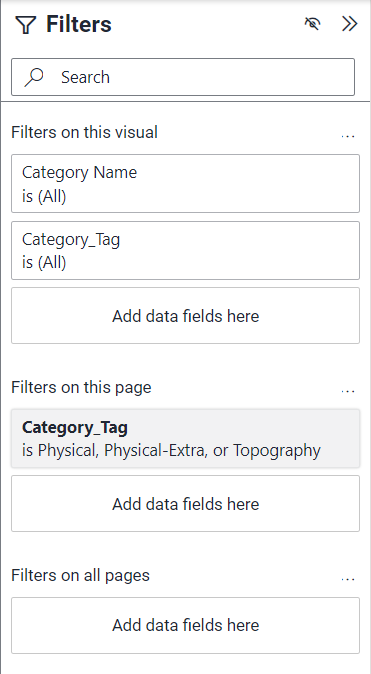
Filters pane
The Filters pane enables you to configure and view the filters applied to data within visuals. There are three levels of filters:
- filters that apply only to the selected visual
- filters that apply to all visuals on the current page
- filters that apply to all visuals on all of the pages in a report
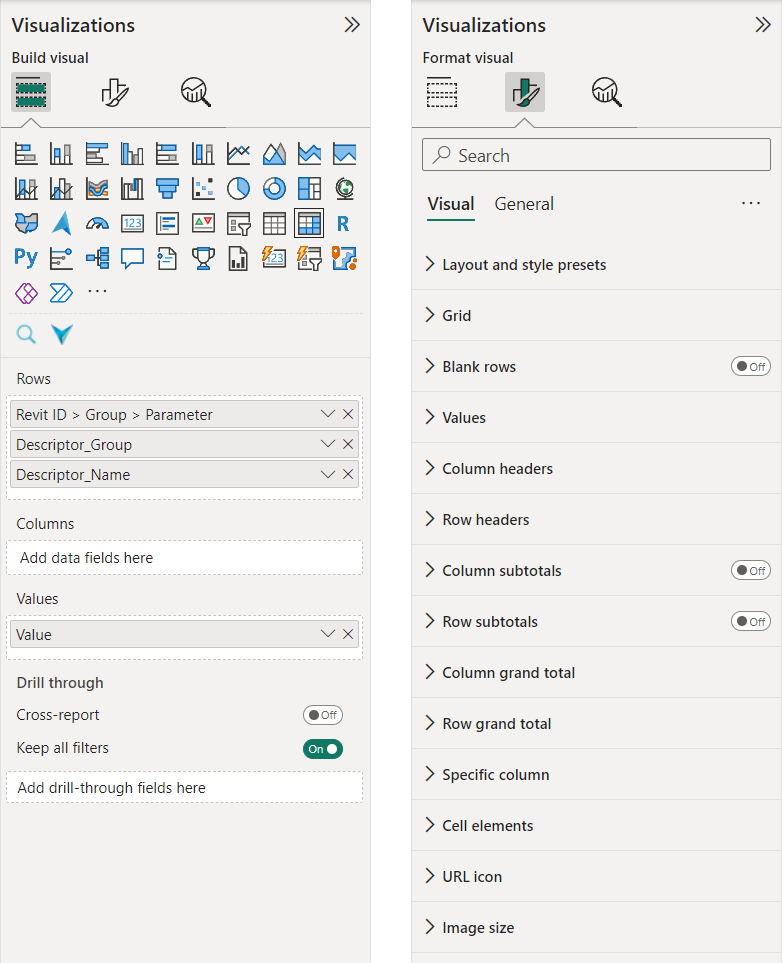
Visualizations pane
The Visualizations pane contains all of the different visuals that are available for creating reports, including tables, matrices, charts, and text boxes.
- Build Visual panel — enables you to place visuals on the Canvas and assign data
- Format Visual panel — contains two panels: the Visual panel contains settings specific to the type of visual selected; the General panel contains settings that apply to all visuals
The sample Power BI template includes the WebGL Viewer as a custom visual (the VIM icon in the image below), enabling you to display interactive 3D data from VIM files within your reports.
Build visual panel (left) and Format visual panel (right)
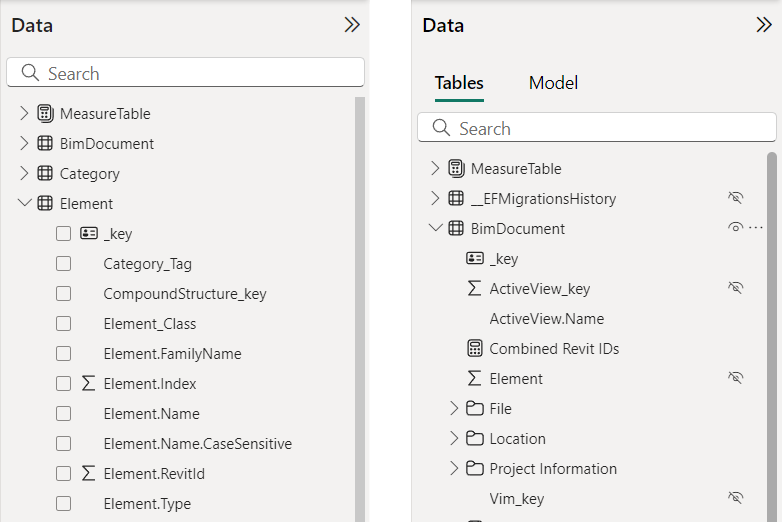
Data pane
The Data pane displays the tables, folders, and columns available, based on the data model. Note that in the sample template, when the Data pane is displayed within the Model view or Table view, there are some tables and columns visible that are hidden from the Report view. These tables and columns have been hidden to simplify data selection when creating visuals.
Data pane in the Report view (left) and the Model view (right)
Page Navigation
Page Navigation enables you to move between the different report pages, as well as add, remove, rename, and re-order pages. When viewing reports with many pages, use the Previous Pages/Next Pages arrow buttons to scroll left or right and view pages that are not currently visible.

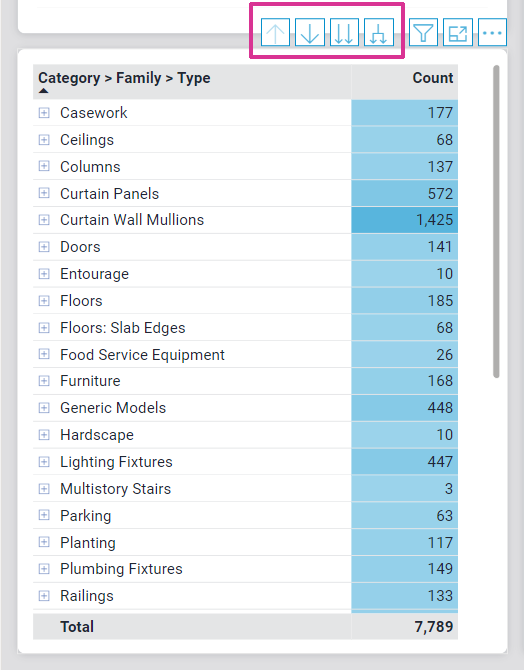
Drilling
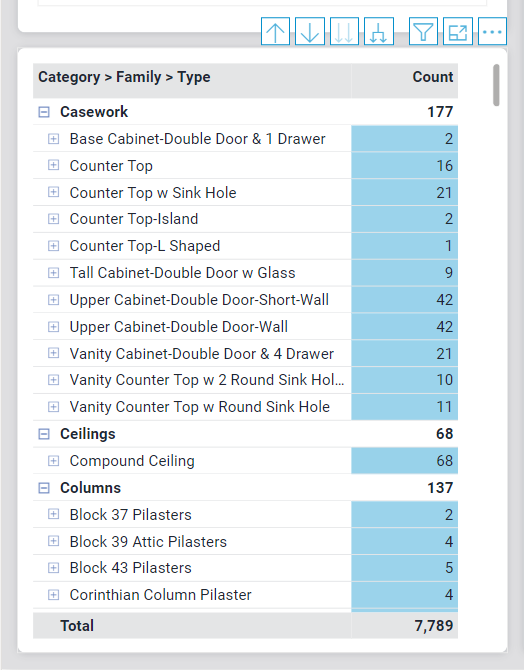
The Power BI drilling controls provide the ability to quickly navigate up or down within the hierarchy of data in a visual. The controls are displayed when you hover your mouse over a visual that contains hierarchical data, such as the Element Category matrix in the sample Power BI template (see below). Drilling can also be used with charts and graphs if they are configured with hierarchical data.
Drilling controls (L to R): Drill Up, Drill Down, Go to the next level, Expand all down one level
Drill Up
Drill Up is only available when you have already drilled down into hierarchical data. Drill Up moves up the hierarchy of data one level at a time. If you have drilled down multiple levels, you will need to drill up multiple times to return a visual to its default state. You can also right-click on a row and choose Drill Up, but if the visual is already at the top of the hierarchy, the command will not be available.
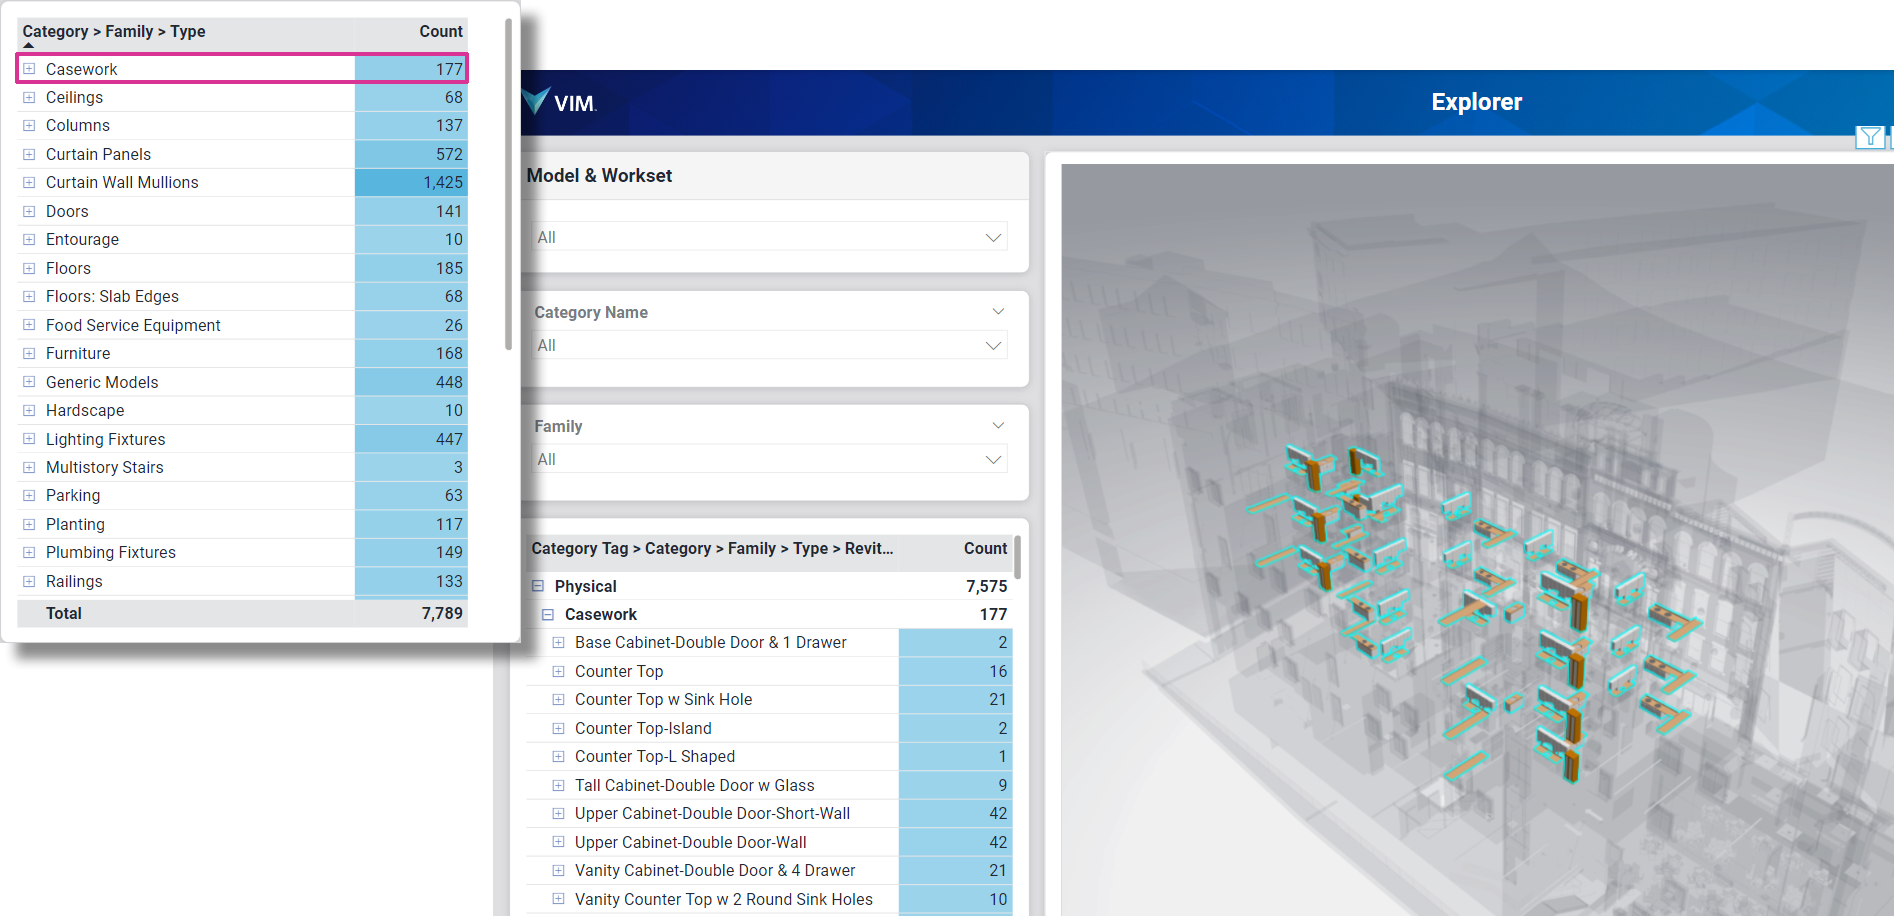
Drill Down Mode
Drill Down enables/disables Drill Down mode. In Drill Down mode, clicking on a row in a matrix tree view will isolate the selected row, display the second level of data for the selected item, and highlight all of the selected items in the 3D view (see the Casework example below). You can drill down to the lowest level in a hierarchy. Use Drill Up to return to the previous level or return a visual to its default state. You can also right-click on a row and choose Drill Down. If you are already at the bottom of the hierarchy, the command will not be available.
Go To the Next Level
The Go to the next level control drills down to the next level in the hierarchy, displaying all of the items in that level, from all categories. You can use this control to go down to the lowest level in the hierarchy.
Expand All Down One Level
The Expand all down one level control expands all of the top-level rows to display the next level in the hierarchy. You can use this control to go down to the lowest level in the hierarchy.
Related Topics
Getting Started with Power BI
Power BI Template Tutorial